AF
← Back to work

Case study · Summer 2026

A Computer Vision Evaluation: Finding London's Biggest Gardens

Garden size is one of the few things that materially changes how liveable a London property is, and it's one of the only things you can't search for. Property websites like Rightmove and Zoopla filter by bedrooms, price, and whether there's a garden at all — not how big it is. Two houses on the same street, same price, same bed count, can have a 30m² garden and a 90m² garden, and there's no way to know which without opening every listing and squinting at a floorplan. I evaluated a computer-vision approach — segmenting garden boundaries from aerial imagery — against a national land classification dataset that already tags every garden in the country, then built the interactive tool on whichever one actually won.

Stack

OS NGD API · GeoPandas · Folium · OpenStreetMap · Python

Data

34,000+ garden polygons classified

Areas

E10, E17 · Waltham Forest

0

property portals where garden size is a searchable field

£2

total cost to classify and rank every garden in two postcodes

34,030

garden polygons classified across two London postcodes

197m²

biggest street median found, vs a 47m² district low

01

The Problem

Space is the scarcest thing in London property. Garden size is the part of that scarcity nobody's built a tool for.

Estate agents don't store garden area as a searchable field. Zoopla's own listing guidance explicitly excludes gardens and outbuildings from the internal floor-area figure they do collect. When garden size is captured at all, it's usually locked inside a floorplan image or an EPC certificate, never treated as structured data. Buyers have been asking both major portals to add this as a filter for years. Neither has.

Two ways to close that gap: segment garden boundaries directly from aerial imagery with a computer vision model, or find out whether a national mapping agency has already done the classification. I evaluated both. Ordnance Survey's National Geographic Database labels every land parcel in Great Britain by use — "Residential Garden" is a category, tagged from an actual topographic survey rather than inferred from pixels. That's the dataset the finished tool runs on.

This case study covers both paths side by side, two data sources along the way that looked plausible and gave wrong answers, and the ranked list of streets that answers the question a bigger-garden house hunt actually needs answered.


02

The Evaluation Journey

Attempt 01INSPIRE property polygons (free)wrong

HM Land Registry title boundaries. Produced gardens up to 453m² — turned out to be shared driveways and multi-house titles, not individual gardens.

Attempt 02Building-footprint subtractionwrong

Property area minus OS building footprint, as a proxy for garden area. Still wrong: sheds, extensions and outbuildings are generalised away in the free building layer, inflating every result.

Attempt 03OS NGD Land featuresworked

Ordnance Survey's National Geographic Database classifies every land parcel in Great Britain by use. "Residential Garden" is a literal field value. Premium tier, but the free £1,000/month credit covers a full analysis for pennies.

Attempt 04Garden-to-building pairingwrong

Attempted to attribute each garden polygon to its nearest house, for a per-property view. NGD garden polygons routinely touch 4–6 neighbouring buildings with no clean 1:1 mapping. Dropped in favour of street-level aggregation.


03

Two Approaches

Two ways to answer the same question: pixels, or parcels.

Vision approach — aerial imagery + segmentation

License imagery

Bluesky/Getmapping 25cm aerial, commercial licence

Tile & georeference

Cut into tiles, align to OS National Grid

Label ground truth

Annotate garden boundaries for training data

Train / fine-tune

SAM 2 or U-Net segmentation, GPU time, evaluation loop

Post-process

Vectorise masks, calculate area, validate against samples

Data approach — land classification

Query OS NGD

Land features API, filter to Residential Garden

Filter

Drop implausible sizes (<25m² or >500m²)

Join boundaries

OSM street geometry via spatial join

Aggregate & rank

Median per street across the district

Vision approach

# Aerial imagery + SAM 2 segmentation model = SAM2(checkpoint="sam2_hiera_l") for tile in aerial_tiles: mask = model.predict( image=tile, prompt="garden" ) area = vectorise(mask).area # validate against ground truth, # retrain, repeat

Data approach (Python)

# Ground truth already exists r = requests.get( f"{BASE}/lnd-fts-land-3/items", params={ 'bbox': bbox, 'filter': "description=" "'Residential Garden'", 'filter-lang': 'cql-text', } ) gardens = gpd.GeoDataFrame(r.json())

04 · Finding 1

Every Garden, Mapped

34,030 parcels rendered as an interactive map. Colour and dot size both scale with garden area — dark red is a big garden, pale orange is a small one.
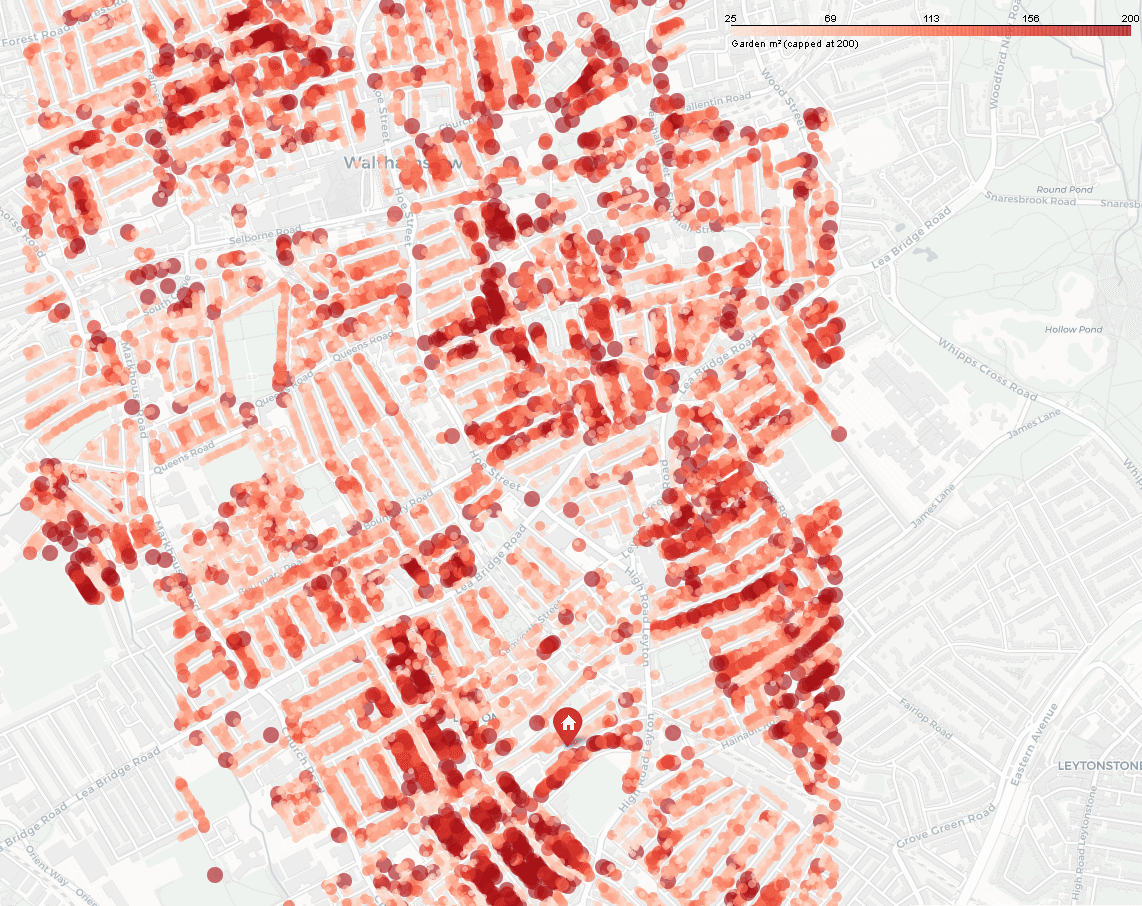
Interactive map showing every classified garden in the study area as a coloured dot, sized and shaded by area

Reading the map: The darkest clusters sit around Higham Hill and the William Morris area, which lines up closely with the street ranking below. Density drops off toward the centre of Walthamstow, where terraces sit closer together and back gardens are shorter. Every dot is clickable in the interactive version and opens directly to a satellite view of that specific garden.


05 · Finding 2

Where to Actually Look

This is the list that answers "where can I find a bigger garden," ranked by median, filtered to streets with at least 10 gardens.

Top 20 streets by median garden size · E10 + E17

1

East Avenue

Hoe Street

197.8

n=18

2

Prospect Hill

Hoe Street

184.1

n=14

3

Valognes Avenue

Higham Hill

182.9

n=18

4

South Countess Road

William Morris

172.7

n=30

5

William Morris Close

William Morris

158.8

n=38

6

Blackberry Close

Hoe Street

158.4

n=14

7

Lyne Crescent

Higham Hill

145.6

n=64

8

Boleyn Court

William Morris

130.2

n=11

9

Heron Close

Higham Hill

130.1

n=29

10

Peacock Close

Higham Hill

130.0

n=16

11

Eatington Road

Forest

126.1

n=19

12

Holmes Avenue

William Morris

122.5

n=49

13

Guildsway

Higham Hill

122.3

n=20

14

The Bungalows

Forest

121.1

n=12

15

Swan Pond Close

William Morris

121.1

n=18

16

Cheltenham Road

Forest

120.0

n=47

17

Shaw Square

Higham Hill

118.6

n=24

18

Headway Gardens

Chapel End

117.7

n=39

19

Millfield Avenue

Higham Hill

115.6

n=114

20

Westbury Road

William Morris

114.7

n=10

Insight: East Avenue tops the list at a 197.8m² median across 18 gardens, more than four times the smallest street medians found in the district. Higham Hill and William Morris account for 11 of the top 20 streets between them, which lines up with the darkest clusters on the map above. Millfield Avenue is the most statistically solid entry on the list, a 115.6m² median backed by 114 gardens rather than a handful.


06 · Finding 3

Vision vs Data: Cost and Time

A model can only match ground truth that already exists. When a national mapping agency has done the classification, training one adds cost and error, not accuracy.

2–3 weeks

vision approach, evaluated

imagery licence, labelling, training, evaluation

Licensed aerial imagery at usable resolution (Bluesky, Getmapping) isn't free for anything beyond personal use. A labelled training set of garden boundaries has to be built by hand before a model can learn anything. Then GPU time, evaluation against held-out samples, and iteration.

1 afternoon

data approach, shipped

£2 total, 34,030 parcels classified

OS NGD returns pre-classified land parcels through a paginated API. No model, no imagery licence, no labelling. The £1,000/month free credit on OS Data Hub covers the full two-postcode analysis roughly 500 times over.

Where the classification already exists

worth checking before training anything

CountryAgencyProductAccessGranularity
United KingdomOrdnance SurveyNGD Land — descriptive term "Residential Garden"£1,000/month free creditPer-parcel
NetherlandsKadasterBGT (Basisregistratie Grootschalige Topografie)Fully openPer-parcel, incl. garden class
DenmarkSDFEFOT10 topographic databaseFully openPer-parcel
AustraliaGeoscapeBuildings & Surface CoverFree tier, data.gov.auPer-property, coarse
New ZealandLINZBuilding Outlines + Property ParcelsFully openBuilding only, no garden class

07

A Data Quality Trap

The street ranking above only holds up because of a filter that isn't obvious until you hit the problem it fixes.

Fragmentation

NGD splits a single property's outdoor space into several polygons: front garden, back garden, side return. Joined to street geometry without a floor, that fragmentation drags well-known streets' medians down to 30–35m², which reads as implausibly small for streets with visibly generous back gardens.

A floor on polygon size (25m², below which a polygon is far more likely a front-garden sliver than a usable back garden) plus a minimum sample size of 10 gardens per street recovers a materially different, more plausible ranking on the same streets. Getting this right mattered more than any other single decision in the analysis: it's the difference between a dataset that matches what you can see standing on the street and one that doesn't.

It's also the reason the street list above stops at 20 rather than running to every street in the district. Below a certain sample size, one oddly-shaped garden can swing a street's median by 50m² or more. The list is deliberately restricted to streets where the number is trustworthy.


08

Before You Reach for a Model

Three questions worth asking first.

$ evaluate --before-training

1. Does a national mapping or cadastral agency already classify this land use?

→ yes — OS NGD, "Residential Garden"

2. Is that classification's granularity what's actually needed?

→ yes — parcel-level area is the whole question

3. Does the answer need to track change over time, or is it static?

→ static — garden boundaries rarely move

verdict: no model needed

Flip any of these and the calculation changes. Surface-type classification within a garden (lawn vs patio vs decking) isn't in NGD — that's a real vision problem. Change detection over time (has this garden been paved over since 2020?) is also a real vision problem. Ranking gardens by size, when a national agency already tags them by use, is not.


Interested in this work?

Always interested in discussing geospatial data, applied ML evaluation, and when not to use a model.